Sales appear to be down because of a surge in delayed transactions that closed last July
HOUSTON — (August 11, 2021) — By the numbers, Houston-area home sales were down this July compared to last. However, that is because COVID-related home closing delays during Q2 2020 finally pushed through that July as most of the pandemic lockdowns were lifted. The resulting surge of pent-up sales cemented July 2020 in the real estate history books as a record-setting month that could not be rivaled by the rapid-fire pace of the current market.
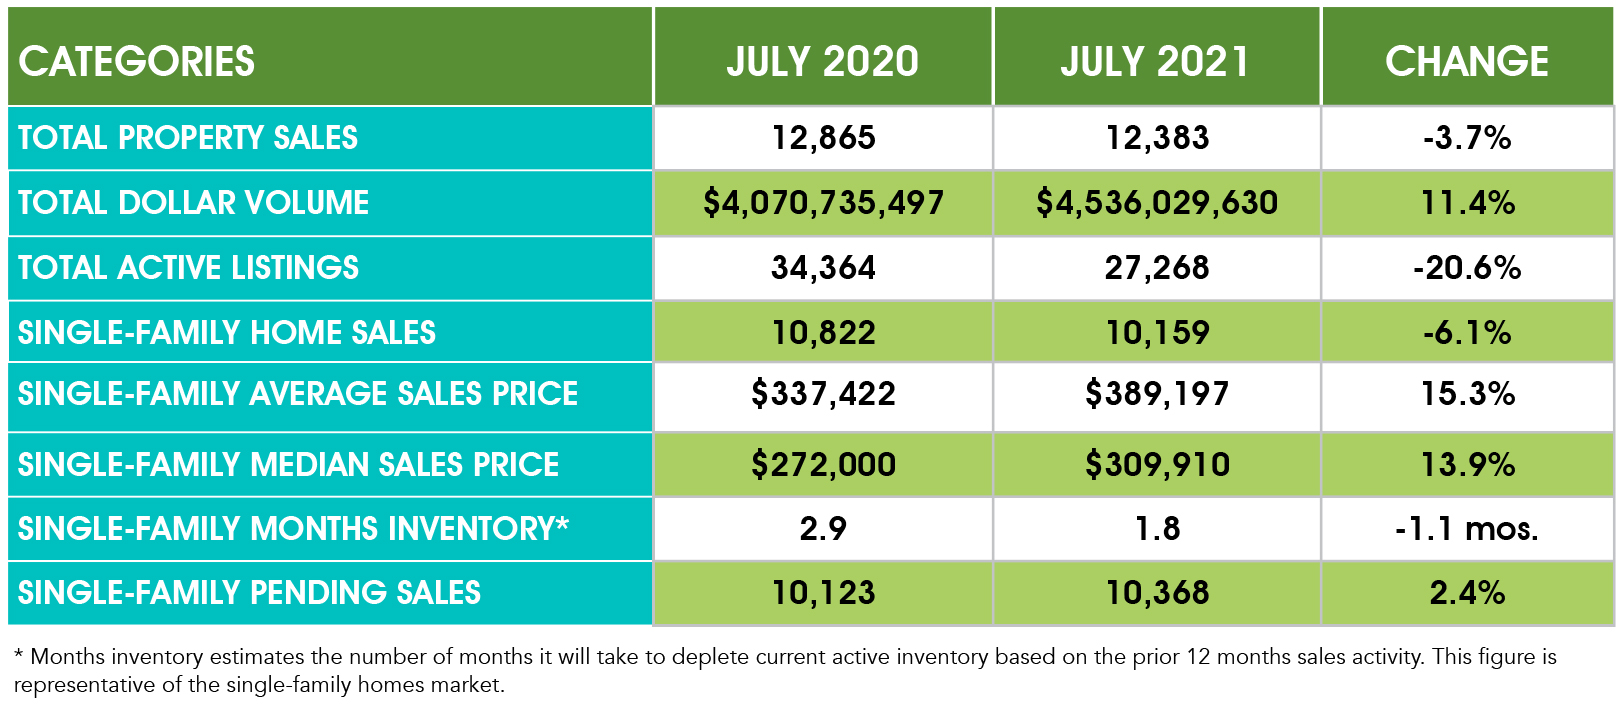
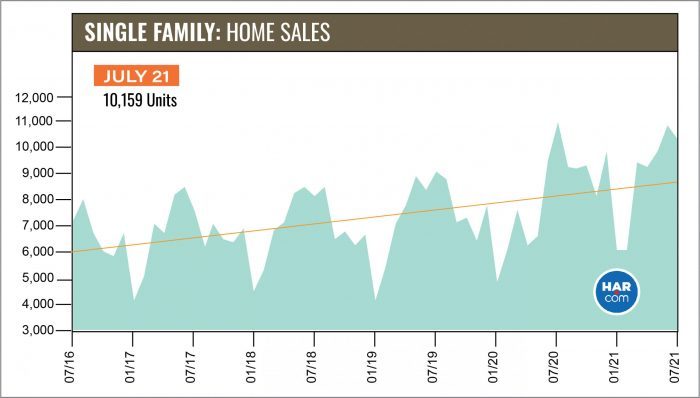
According to the Houston Association of Realtors (HAR) July 2021 Market Update, single-family homes sales were down 6.1 percent compared to last July, with 10,159 units sold versus the historic 10,822 that sold a year earlier. However, when compared to July 2019 — an average month of home sales with volume totaling 8,921 — the Houston housing market was up 13.9 percent. On a year-to-date basis, local home sales currently exceed 2020’s record pace by 19.1 percent.
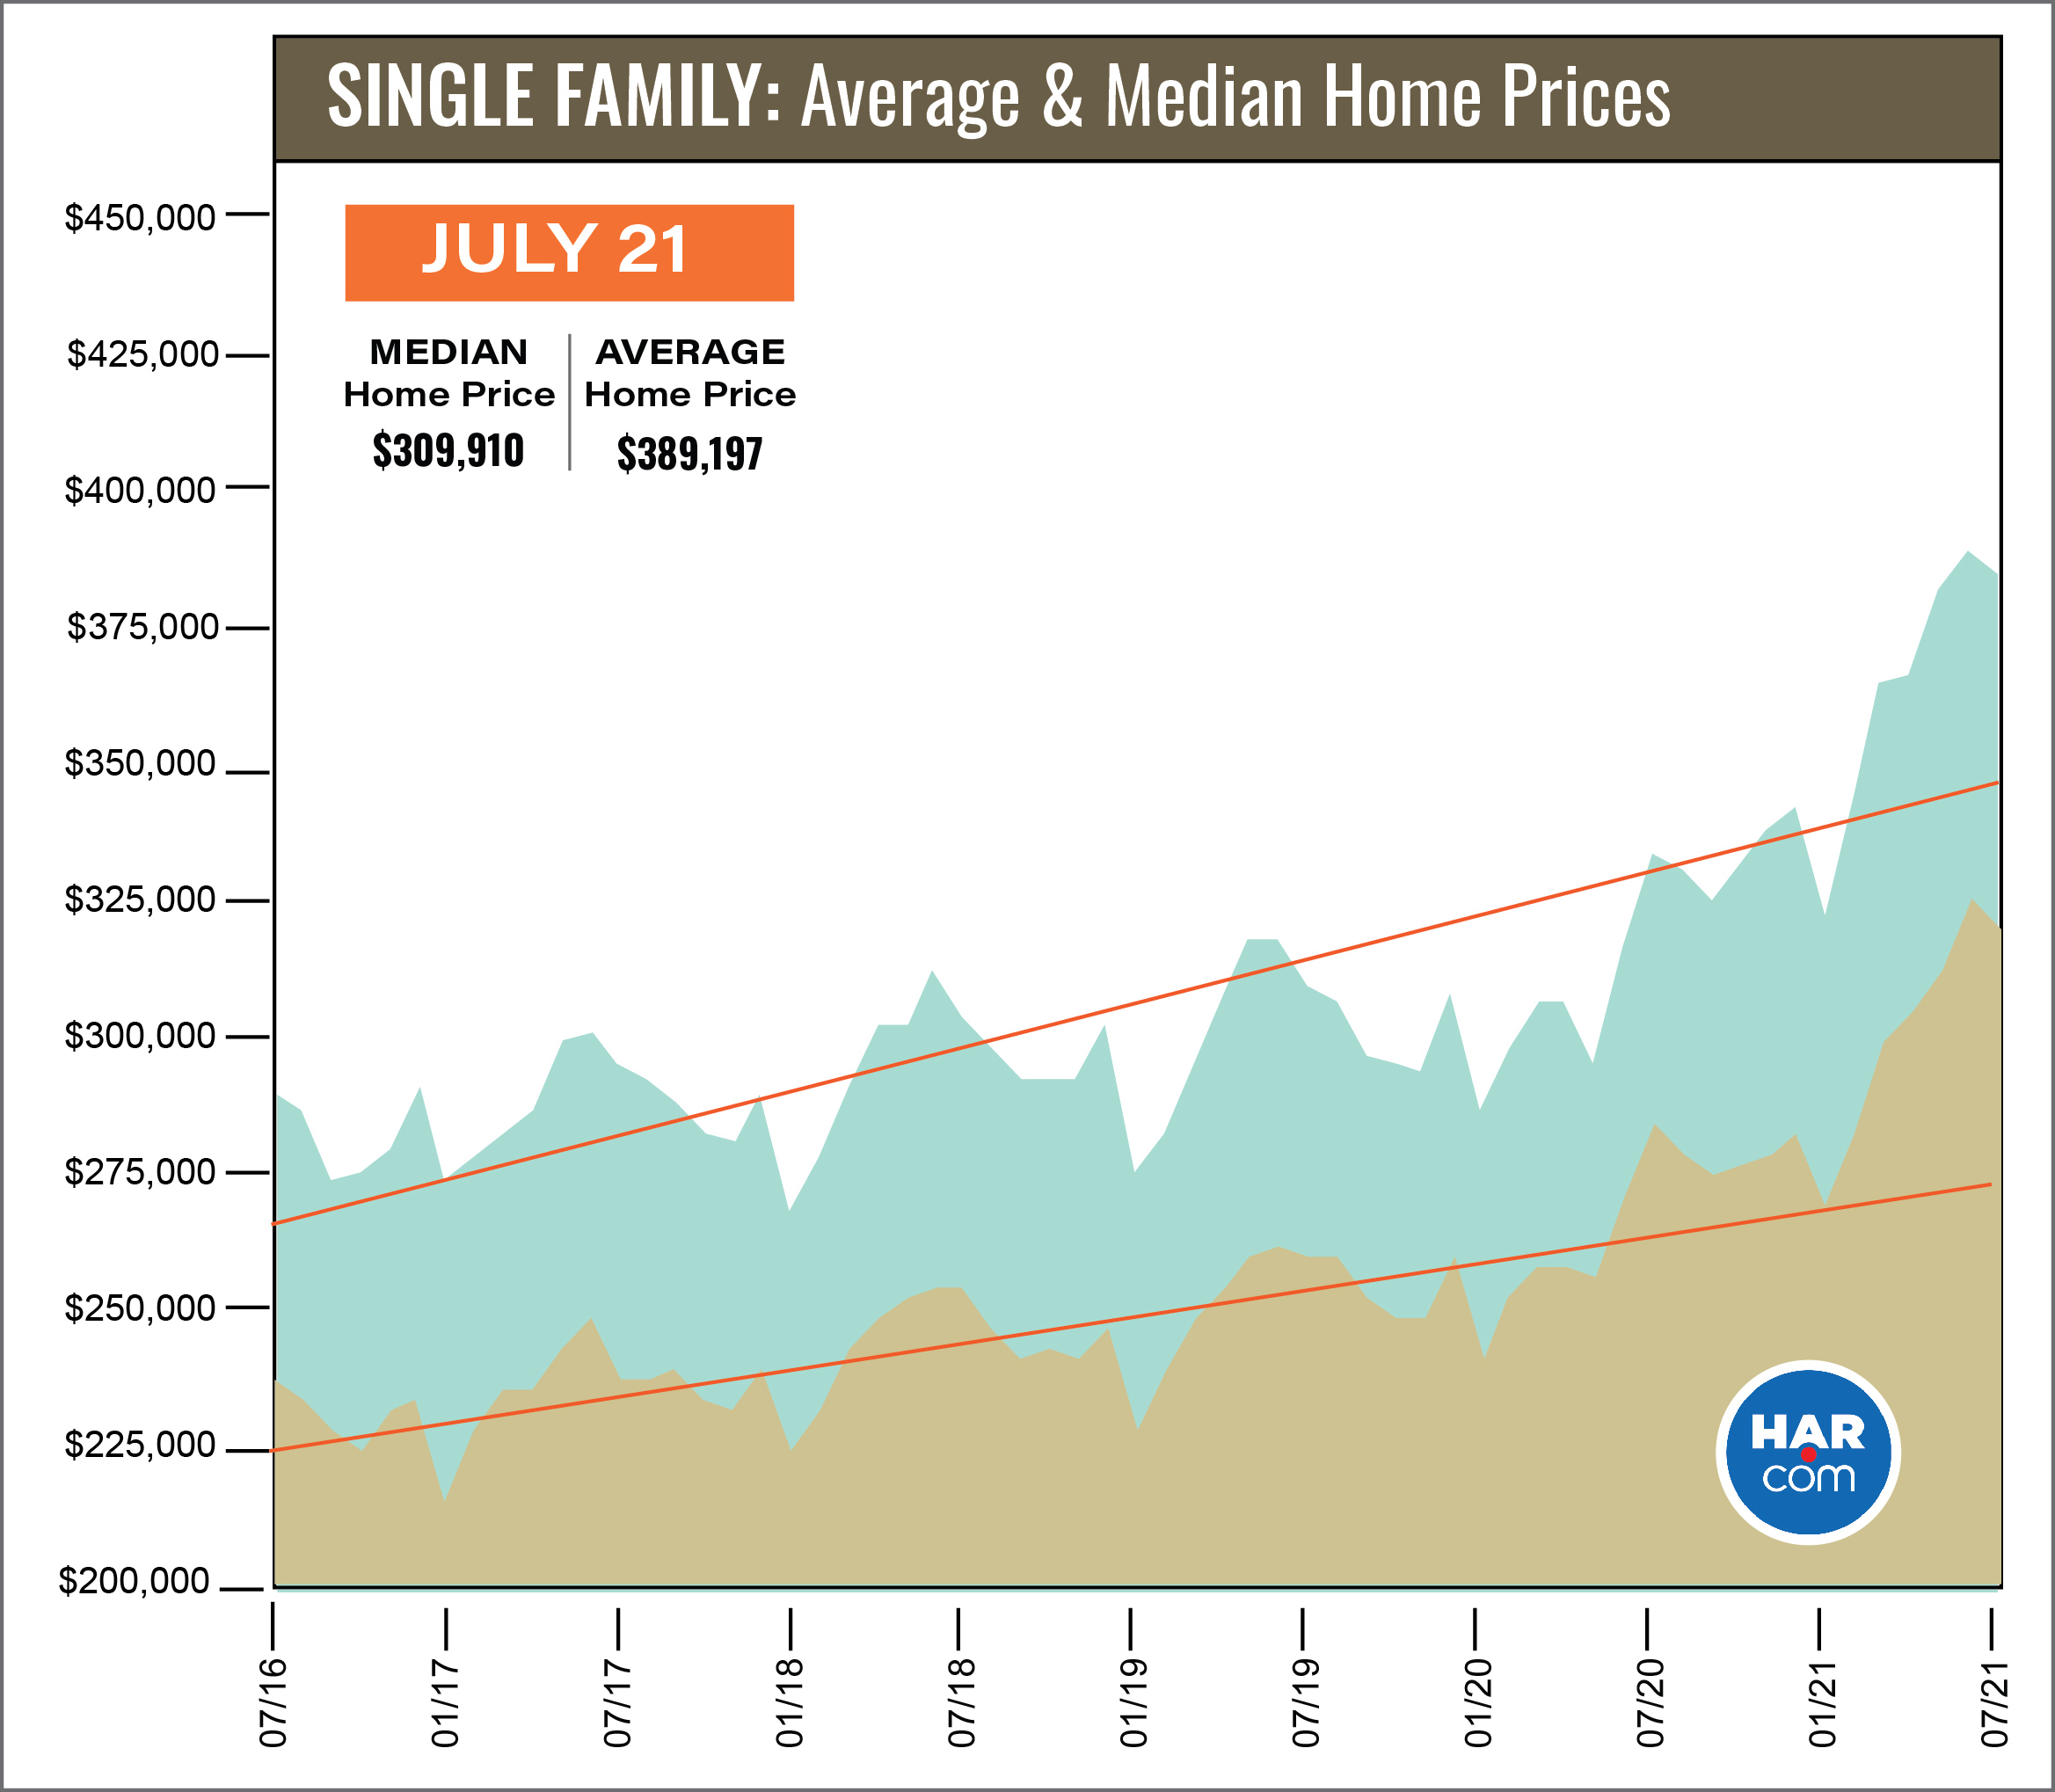
Once again, homes priced from $750,000 and above led the way in sales volume with a 36.7 percent year-over-year increase. That was followed by the $500,000 to $750,000 segment, which rose 18.9 percent. The single-family home average price increased 15.3 percent to $389,197 and the median price climbed 13.9 percent to $309,910. That marks the second highest pricing of all time behind last month’s record-setting figures.
Sales of all property types fell 3.7 percent year-over-year, totaling 12,383. That is the third greatest volume of all time behind June 2021 (13,115) and July 2020 (12,865). Total dollar volume for the month rose 11.4 percent to $4.5 billion.
“We know anecdotally that the Houston real estate market is still red-hot, but the statistics make it appear to be slower than a year ago because of the surge in home closings that took place last July when the market began to normalize with the lifting of pandemic-related restrictions,” said HAR Chairman Richard Miranda with Keller Williams Platinum. “Assertive investors and cash buyers are still controlling the tides of this seller’s market, but hopefully that will moderate with a continued influx of new listings.”
In June 2021, the ‘Close to Original List Price Ratio’ for single-family homes reached 100.3 percent — the highest ever. That means that a majority of buyers paid above list price for homes on the market. This July, it was 100.2 percent, indicating that this high-dollar buying trend continues.
Lease Property Update
As in June, consumer demand for lease properties was down in July and rent prices were up. Single-family lease homes fell 20.1 percent year-over-year while leases of townhomes and condominiums dropped 10.8 percent. The average rent for single-family homes jumped 11.4 percent to a record $2,162 while the average rent for townhomes and condominiums increased 5.8 percent to $1,756.
July Monthly Market Comparison
The Houston housing market saw 13 consecutive months of positive sales come to an end in July as a result of a statistical anomaly. A surge in pandemic-delayed home closings in July 2020 set record levels that were no match for even the robust pace of the current market.
Single-family home sales and total property sales registered declines versus last July while total dollar volume rose. Pending sales increased 2.4 percent. However, total active listings — or the total number of available properties — remain 20.6 percent lower than this same time last year.
Single-family homes inventory reached a 1.8-months supply in July, down from 2.9 months a year earlier. However, that is the greatest supply of homes that the market has had in 2021 and reflects a 7.8 percent uptick in new listings. Housing inventory nationally stands at a 2.6-months supply, according to the National Association of Realtors (NAR).

Single-Family Homes Update
Single-family home sales fell 6.1 percent in July with 10,159 units sold across the greater Houston area compared to 10,822 a year earlier. The decline reflected pandemic-related delays in closings during Q2 2020 that finally pushed through to record levels that July once lockdowns were lifted. However, in comparison to July 2019 — an average month of home sales — the Houston housing market was up 13.9 percent.

The single-family home average price climbed 15.3 percent to $389,197 while the median price rose 13.9 percent to $309,910. Those are the second highest pricing levels in Houston real estate history.

The time it took to sell a home fell by almost four weeks compared to July 2020. Days on Market (DOM) went from 56 to 26. Inventory registered a 1.8-months supply compared to 2.9 months a year earlier. That level is the highest of 2021 but is below the current national inventory of 2.6 months recently reported by NAR.
Broken out by housing segment, July sales performed as follows:
- $1 – $99,999: decreased 38.0 percent
- $100,000 – $149,999: decreased 37.7 percent
- $150,000 – $249,999: decreased 37.8 percent
- $250,000 – $499,999: increased 12.0 percent
- $500,000 – $749,999: increased 18.9 percent
- $750,000 and above: increased 36.7 percent
HAR also breaks out sales figures for existing single-family homes. Existing home sales totaled 8,859 in July. That is up 1.1 percent from the same month last year. The average sales price rose 17.2 percent to $388,876 while the median sales price climbed 15.3 percent to $305,000.
For HAR’s Monthly Activity Snapshot (MAS) of the July 2021 trends, please click HERE to access a downloadable PDF file.
Townhouse/Condominium Update
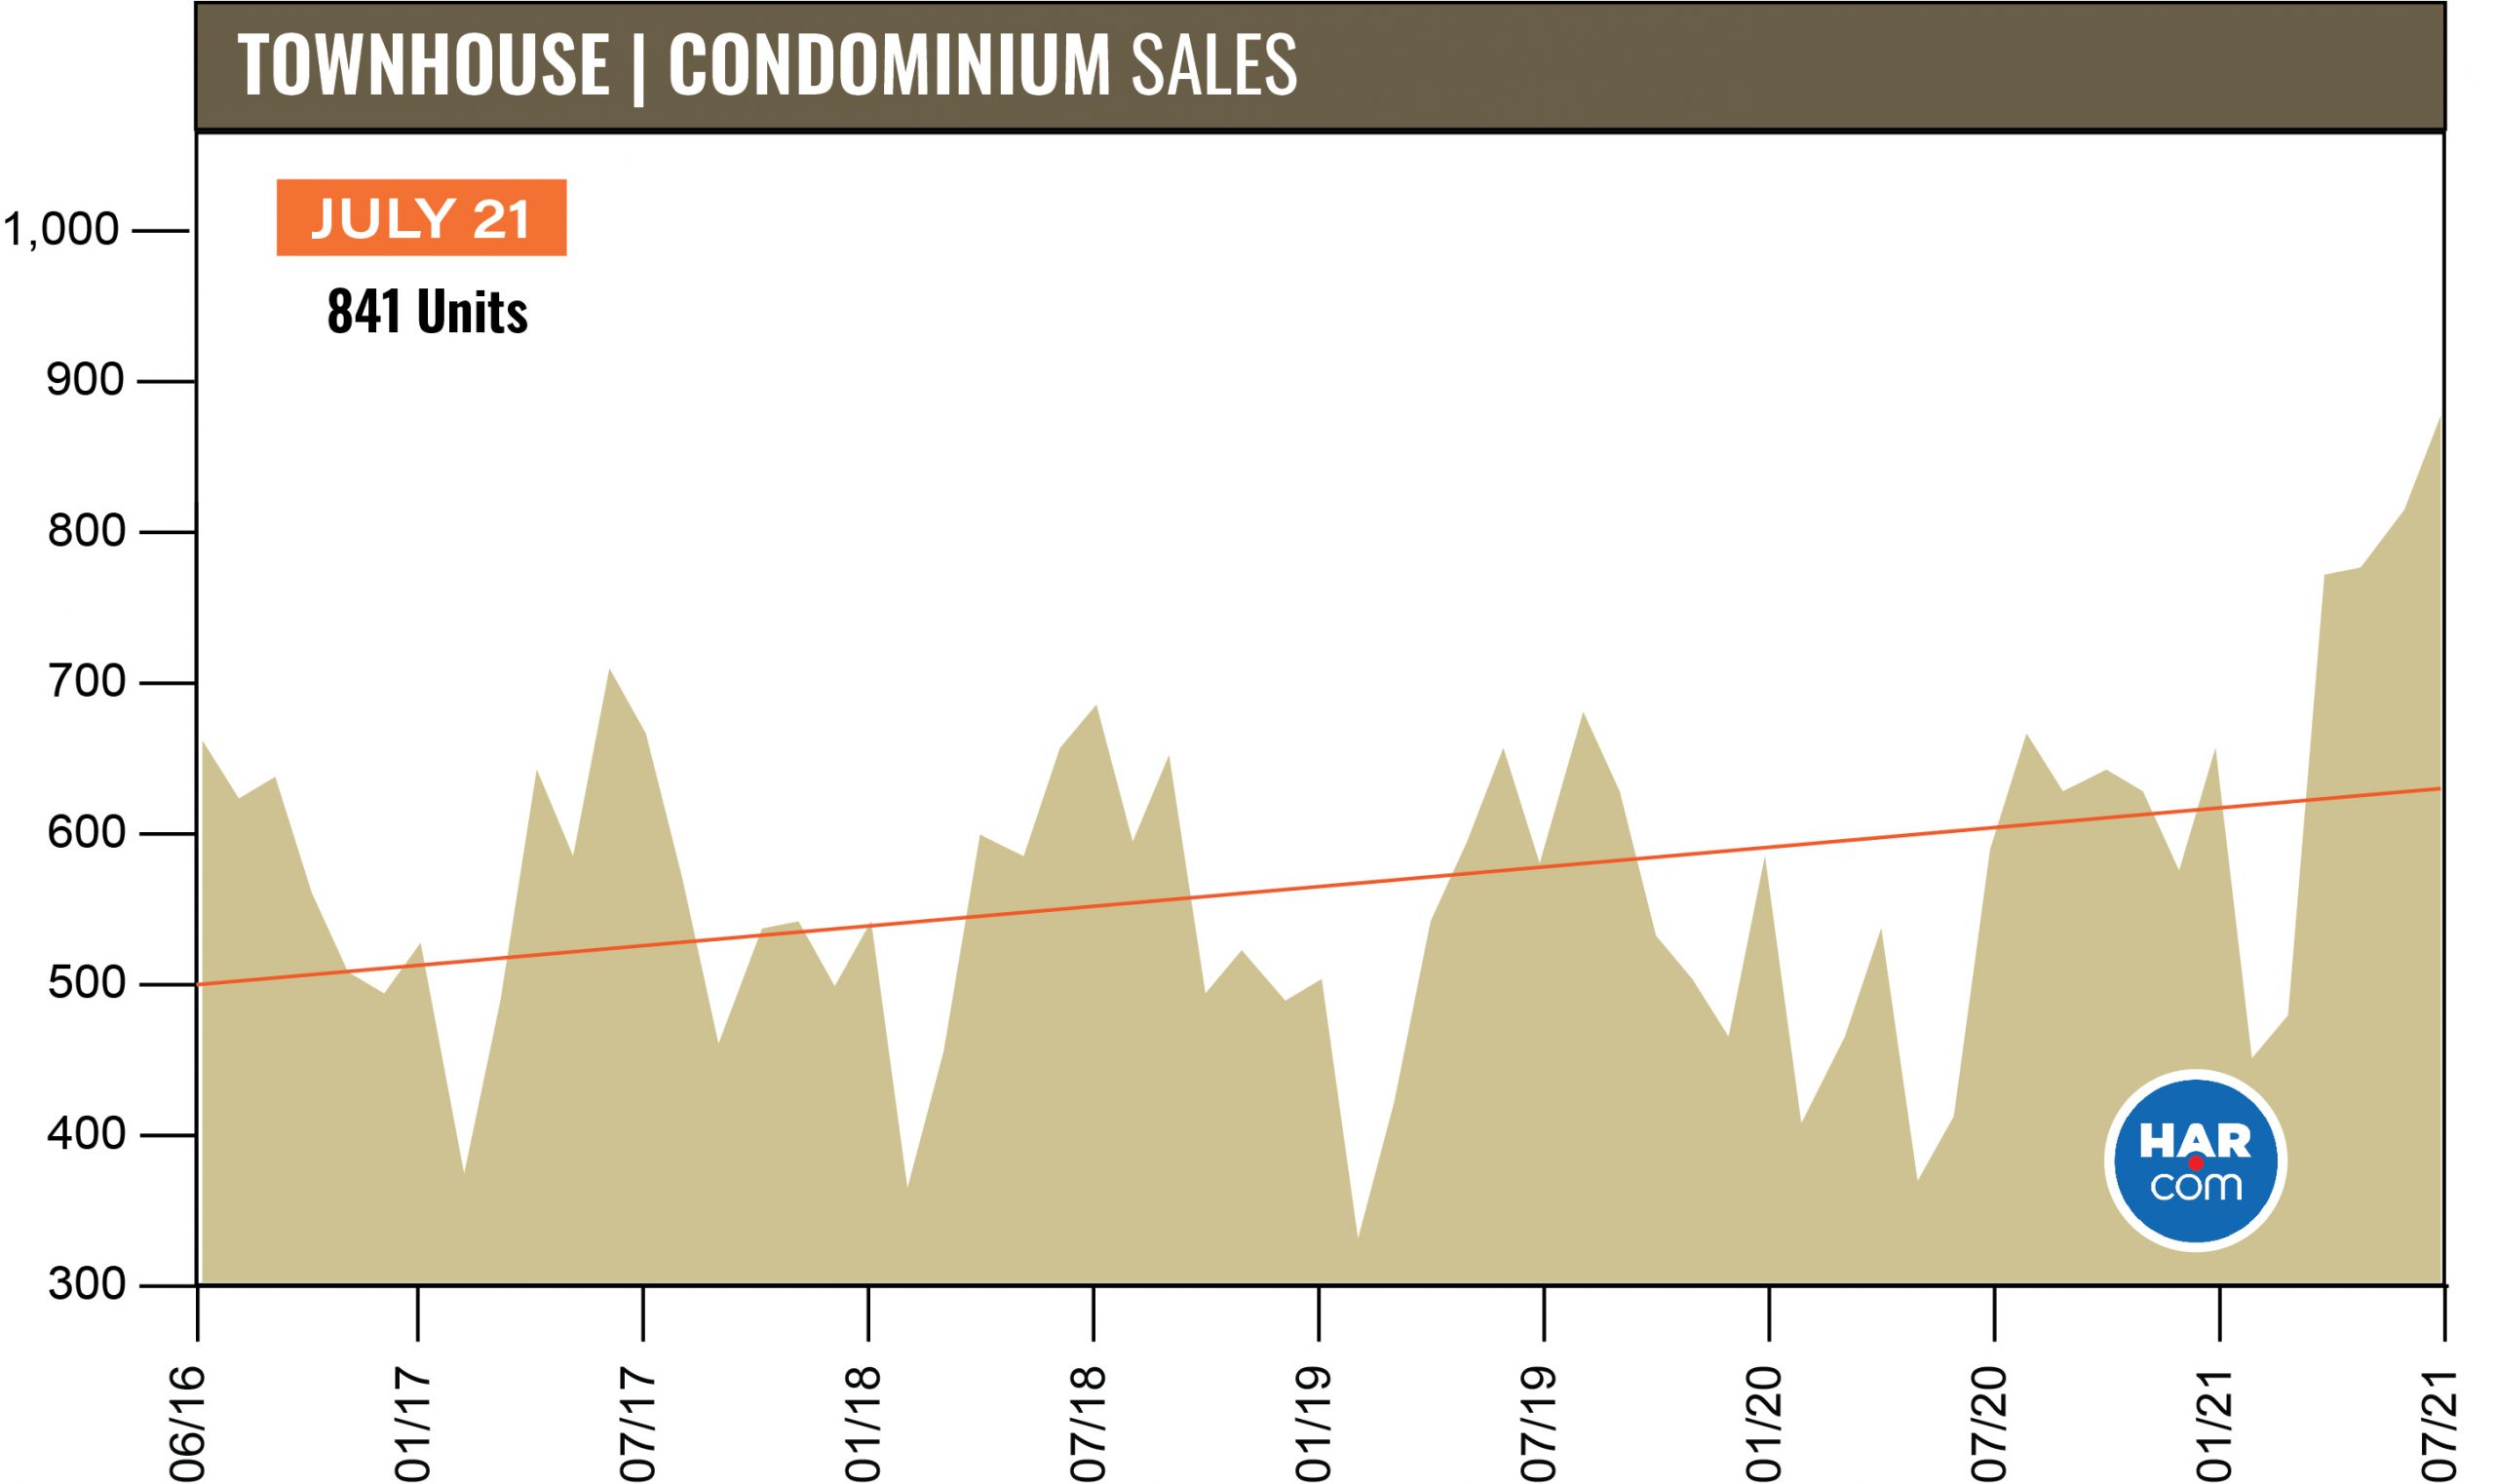
Sales of townhouses and condominiums increased for the eleventh consecutive month in July, jumping 23.9 percent with 841 closed sales versus 679 a year earlier. The average price rose 10.0 percent to $245,160 and the median price climbed 8.7 percent to $200,000. Inventory fell from a 4.1-months supply to 2.6 months.

Houston Real Estate Highlights in July
- Single-family home sales ended a 13-month positive run with a 6.1 percent decline, as 10,159 units sold versus 10,822 in July 2020. The year-ago sales surge came after COVID-related lockdowns were lifted, enabling Q2 2020 postponed closings to proceed;
- The Days on Market (DOM) figure for single-family homes fell from 56 to 26;
- Total property sales fell 3.7 percent with 12,383 units sold;
- Total dollar volume increased 11.4 percent to $4.5 billion;
- The single-family average price reached the second highest level of all time, increasing 15.3 percent to $389,197;
- The single-family median price rose 13.9 percent to $309,910 — the second highest median price of all time;
- Single-family homes months of inventory registered a 1.8-months supply, down from 2.9 months year-over-year and below the national inventory of 2.6 months;
- On a year-to-date basis, single-family homes sales are running 19.1 percent ahead of 2020’s record pace.
- Townhome/condominium sales jumped 23.9 percent with the average price up 10.0 percent to $245,160 and the median price up 8.7 percent to $200,000;
- Single-family home rentals fell 20.1 percent with the average rent up 11.4 percent to a record high $2,162;
- Townhome/condominium leases dropped 10.8 percent with the average rent up 5.8 percent to $1,756.
